Your Cheapest Channel Is Probably the One You’re Ignoring
Paid platforms come with dashboards, notifications and a constant invitation to look. Email and word of mouth don’t. Guess which ones quietly earn the most.
Here’s a pattern that shows up almost every time a small business genuinely compares its marketing channels on profit rather than on activity: the channels earning the most are not the ones getting the most attention. A modest email send returns more than a month of paid social. Referrals bring in real revenue at zero cost and appear in nobody’s report. Meanwhile the campaign that consumed the most budget, thought and anxiety turns out to be running at a loss. It isn’t a mystery why this happens, and it’s fixable. Comparing marketing channel performance on the profit column — rather than on how visible each channel is — is one of the highest-return hours a small business can spend. Here’s why the distortion exists, and how to correct it.
Attention follows dashboards, not returns
The mechanism is straightforward. Paid platforms are built to hold your attention: they have dashboards, live numbers, notifications, and an interface that rewards checking. They actively invite you to look, tinker and spend more.
Email, referrals and word of mouth don’t do any of that. Nothing pings you when a customer recommends you to a friend. No interface congratulates you on your open rate. These channels are quiet, and quiet channels get proportionally less thought, less budget and less effort — not because anyone decided they were less valuable, but because nothing prompts you to think about them.
So attention flows toward whatever is loudest, and that has almost nothing to do with what’s most profitable. The only way to correct it is to force a comparison the platforms will never present: all your channels, side by side, on the same measure.
Compare on profit, not on ROAS or activity
When you do line them up, the useful column is profit — revenue attributable to the channel, minus what you spent on it.
ROAS is helpful within a channel, but it’s misleading across channels because it ignores scale. A channel at 8.0x that generates a few hundred dollars of revenue is contributing less than one at 3.0x that generates several thousand. Ratios are for efficiency; profit is for decisions. And decisions about where next month’s budget goes should be made on profit.
This also surfaces the uncomfortable ones. A channel with a negative profit column isn’t underperforming — it’s actively costing you, and every additional dollar you put in makes it worse. That’s an obvious conclusion once you see it, and almost invisible while you’re looking at engagement.
An honest caveat: attribution is approximate in every system, so treat these as directional. The point isn’t that one channel earned exactly $1,363. It’s that one channel is clearly and repeatedly earning while another is clearly and repeatedly draining, and the gap is far too large to be an attribution artefact.
Zero-spend channels are not zeros
There’s a subtle reporting trap worth naming: channels with no ad spend often show up as nothing at all — no spend, no ROAS (you can’t divide by zero), so they fall out of the analysis entirely.
That’s exactly backwards. A channel producing revenue at zero cost is the most profitable thing in your business. It should be treated as free revenue, sitting proudly at the top of your profit column, not as a blank row.
Once you look at it that way, the strategic question changes. Instead of “how do I improve my paid campaigns?”, it becomes “what would happen if I put some real effort into the free ones?” A referral scheme. A reason for happy customers to mention you. A better welcome sequence for your list. Those are the highest-margin marketing activities available to almost any small business, and they’re chronically under-invested in precisely because they never demanded attention.
Underspending is a problem, not a saving
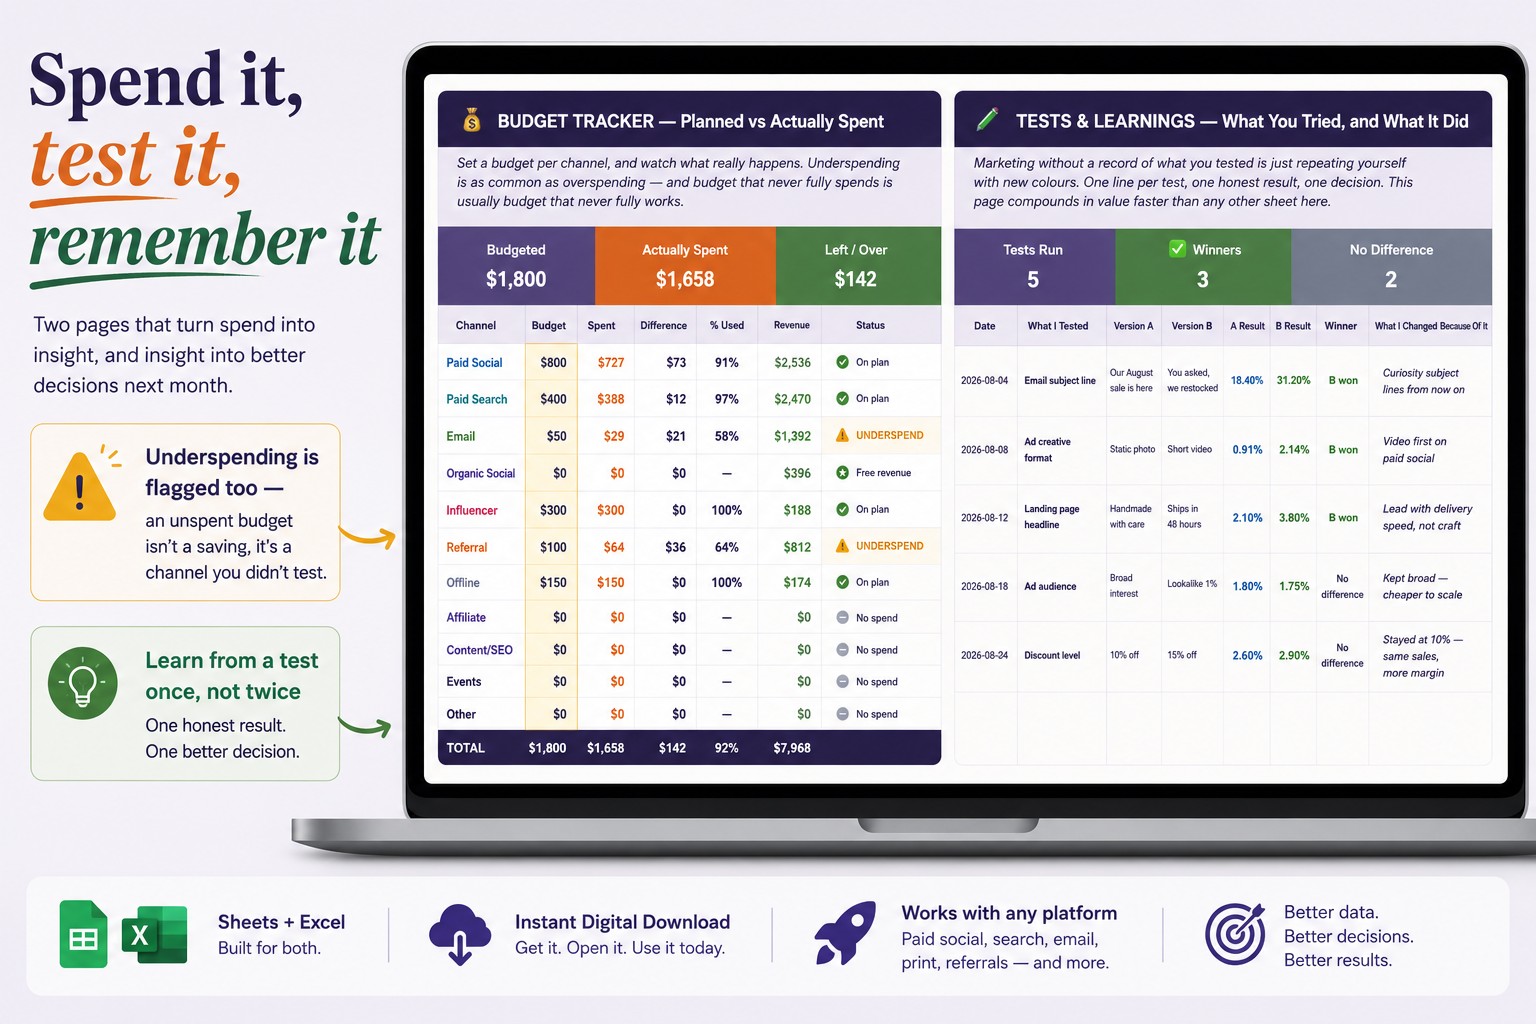
The other thing a proper budget view reveals is the opposite of what people expect. Everyone tracks overspending. Almost nobody flags underspending — and underspending is a genuine problem.
If you budgeted for a channel and didn’t spend it, one of two things happened: you decided not to and forgot to reallocate, or you never got round to it. Either way, that’s budget that produced nothing at all. It’s not thrift; it’s a channel you didn’t test and revenue that didn’t happen.
This matters most for the small experimental budgets — the ones set aside to try something new, which then get quietly not-spent because the existing campaigns absorbed all the attention. Flagging underspend turns that into a visible decision: spend it deliberately, or move it somewhere it’ll work.
Write down what you learned, once
The last piece is memory. Small businesses run tests constantly — a different image, a new subject line, another audience — and then lose the result. Six months later someone tries the same thing again, because nobody wrote down how it went the first time.
A simple test log fixes it: what you tried, what A did, what B did, which won, and — the important column — what you changed as a result. That last one is what converts a test into a decision. A test you don’t act on was just spending with extra steps.
Over a year this accumulates into something genuinely valuable and completely unavailable to buy: a record of what works for your audience, which no benchmark, course or agency can give you.
An important note
To be clear: this is a general perspective on organising your own marketing figures. It is not marketing, advertising, financial, accounting, or professional advice, and it guarantees no result. Any figures mentioned are illustrative examples, not benchmarks, and shouldn’t be treated as typical or achievable — results vary enormously by product, market, audience, season and platform. Attribution is approximate in every system. Platform metrics, fee structures and reporting definitions change and differ between platforms, so work from your own current reports and consult a qualified adviser about your business.
If you want the comparison built for you
I built channel-level reporting into my marketing campaign tracker in Google Sheets — every campaign rolls up by channel with a profit column and an action prompt, zero-spend channels are shown as free revenue rather than blank rows, budget tracking flags underspending as well as overspending, and there’s an A/B test log with a “what you changed because of it” column:
👉 Marketing Campaign Tracker for Google Sheets & Excel
Whether you use mine or a blank sheet, put every channel — paid and free — in one table and add a profit column. The exercise takes an afternoon and it reliably changes where the next month’s budget goes. Your loudest channel and your most profitable one are rarely the same, and only one of them is asking for your attention. 📣
This reflects my own perspective and describes a tracking tool — NOT marketing, advertising or financial advice, and it guarantees no result; figures are illustrative, not benchmarks, and attribution is approximate everywhere. Not affiliated with any advertising platform. Which channel surprised you most when you finally compared them on profit? Tell me in the comments.