

ROAS Is Not Profit
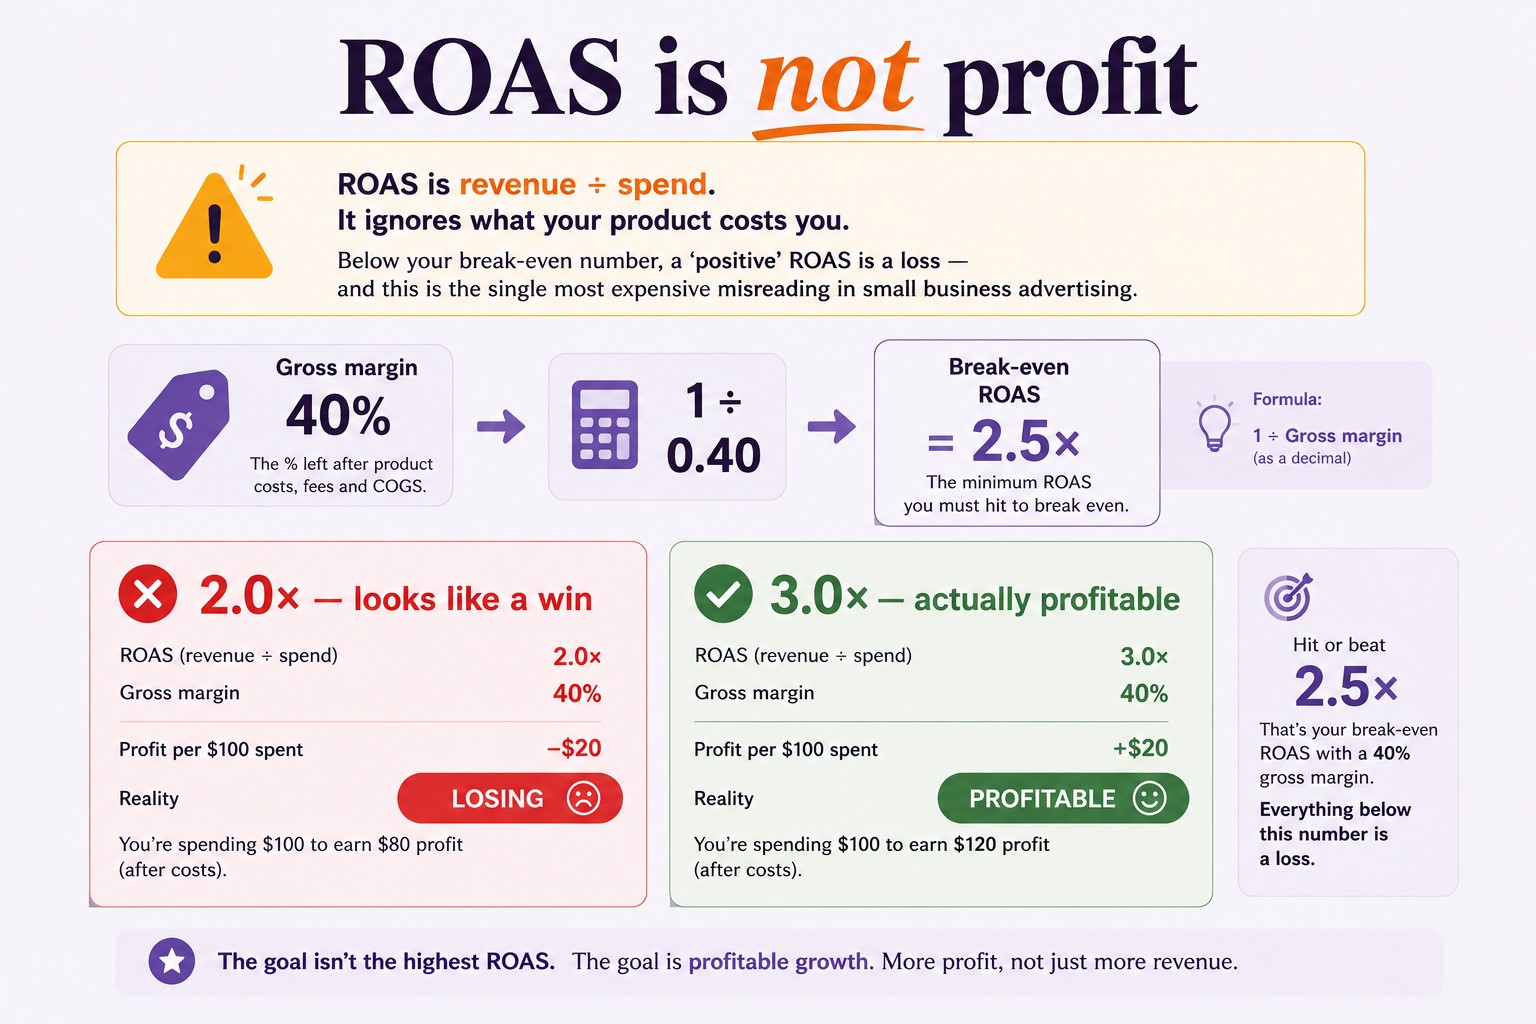
A campaign running at 2.0x return on ad spend looks like a clear win. At a 40% gross margin, it’s losing money. Here’s the break-even ROAS calculation almost nobody does.
Return on ad spend is the metric small businesses reach for when they want to know whether advertising is working, and it’s genuinely useful. It’s also routinely misread in a way that costs real money. ROAS is simply revenue divided by spend — so a campaign that turns $500 of spend into $1,000 of revenue shows 2.0x, which sounds unambiguously good. It isn’t, necessarily. Because ROAS says nothing at all about what your product costs you, and until you’ve worked out your break-even ROAS, you have no idea whether 2.0x is a triumph or a slow leak. This is, in my experience, the single most expensive misunderstanding in small business advertising. Here’s the fix, and it takes about a minute.
The number ROAS leaves out
Revenue isn’t money you keep. Between a sale and your bank balance sits the cost of the thing you sold — materials, manufacturing, wholesale cost, fulfilment, packaging, platform and payment fees. What’s left after those is your gross margin, and that’s the money actually available to pay for advertising and everything else.
ROAS ignores all of it. It compares the top line to your ad spend, as though every dollar of revenue were profit. For a business with high margins, that distortion is small. For anyone selling physical products at typical retail margins, it’s enormous — and it points the wrong way, always flattering the campaign.
That’s why “we’re at 2.0x, we’re doing well” is such a common and such a dangerous sentence.
The calculation
Your break-even ROAS — the point where a campaign neither makes nor loses money — is:
1 ÷ your gross margin
At a 50% margin, that’s 2.0x. At a 40% margin, 2.5x. At a 30% margin, about 3.3x. At a 25% margin, 4.0x.
Look at those for a moment, because they’re sobering. A business running 40% margins needs 2.5x just to break even, which means the campaign at 2.0x that felt like a success is quietly losing money on every sale it generates. And the lower your margins, the higher the bar — a 25% margin business needs to quadruple its spend in revenue before it earns a cent.
Once you have your number, everything gets simpler. Any campaign below it is losing money regardless of how healthy the ROAS looks in isolation. Anything meaningfully above it is genuinely profitable. And you can set a target that’s yours, based on your actual economics, rather than judging yourself against a benchmark you read somewhere that came from a business with completely different margins.
That last point matters more than it sounds. Benchmarks in advertising are close to useless — results vary enormously by product, market, audience, season and platform, and a “good ROAS” for someone else’s business tells you nothing about yours. Your break-even number is the only meaningful reference point, and it’s one you can calculate exactly.
Work out your margin honestly
The break-even figure is only as good as the margin you feed it, so it’s worth being thorough. Include:
- What the product costs you to make or buy
- Packaging and materials
- Shipping and fulfilment, if you absorb it
- Platform and payment processing fees
- Any per-order costs you’d avoid if the order didn’t happen
What you’re after is the margin on an additional sale — the money genuinely freed up by one more order. Overheads that don’t change with volume (your rent, your subscriptions, your own time) sit outside this calculation, but they’re a reminder that break-even ROAS is break-even on the campaign, not on the business. A campaign sitting exactly at break-even contributes nothing toward overheads or your wages. To actually get ahead, you want to be comfortably above it.
Vanity metrics are the other half of the problem
Break-even ROAS protects you from misreading the money. The related trap is being distracted from the money entirely.
Every advertising dashboard leads with impressions, reach and engagement — the metrics that make activity look impressive. And they’re not meaningless; they tell you something about awareness. But they’re not what pays your bills, and they’re presented far more prominently than the metrics that do.
The result is a familiar situation: a campaign delivers tens of thousands of impressions, a handful of sales, and a net loss — and every number on the platform looks fine. Nobody lied. You were just shown the flattering half.
The corrective is to track a small set of money metrics yourself, alongside whatever the platform shows: what you spent, what came back, cost per lead, cost per sale, and ROAS against your break-even number. Five figures, and they answer the question the dashboard doesn’t.
A necessary caveat on attribution
One honest limitation, because anyone selling you certainty here is overselling: attribution is approximate in every system, including any you build yourself.
Someone might see three of your posts, get an email, hear about you from a friend, then search your name and buy. Which channel gets the credit? Every platform answers that differently, most generously to themselves, and none of them untangles it reliably.
So use these figures for direction and comparison — which channels are clearly earning, which are clearly draining, which campaigns are obviously above or below break-even — rather than treating them as precise. The value is in the pattern across months, not in decimal places on a single campaign.
An important note
To be clear: this is a general explanation of how these metrics work. It is not marketing, advertising, financial, accounting, or professional advice, and it guarantees no result. Any figures mentioned are illustrative examples, not benchmarks, and shouldn’t be treated as typical or achievable — advertising results vary enormously by product, market, audience, season and platform. Attribution is approximate everywhere. Platform metrics, fee structures and reporting definitions change over time and differ between platforms, so always work from your own current reports and consult a qualified adviser about your own business.
If you want it calculated for you
I built a marketing campaign tracker in Google Sheets that puts this front and centre — ROAS per campaign and per channel with an automatic verdict (Scale this up, Working, Thin, or LOSING) measured against a target you set, cost per lead and cost per sale side by side, and the break-even ROAS point flagged in the workbook and explained in a plain-English metrics guide:
👉 Marketing Campaign Tracker for Google Sheets & Excel
(No integration or API — you enter figures from your own reports, which is exactly why it works for email, print and referrals too.)
Whether you use mine or a calculator, spend one minute working out your break-even ROAS before you set another target. It’s a single division, it costs nothing, and it’s the difference between scaling something that works and quietly funding something that doesn’t. Track the money, not the vanity metrics. 📣
This reflects my own perspective and describes a tracking tool — NOT marketing, advertising or financial advice, and it guarantees no result; figures are illustrative, not benchmarks, and attribution is approximate in every system. Not affiliated with any advertising platform. Do you know your break-even ROAS? Tell me in the comments — most people have never worked it out.

