You’ve Already Missed the Quarter. You Just Don’t Know Yet.
By the time a quarter feels thin, the deals that would have saved it needed to start months ago. Pipeline coverage is the one metric that tells you early enough to act.
There’s a specific and avoidable kind of pain in any business with a sales cycle. Two-thirds of the way through a quarter, someone notices things look light. There’s a scramble — more outreach, more calls, more activity — and none of it works, because the deals that would have closed this quarter needed to have started two or three months ago. The effort is real and the timing is hopeless. What makes this avoidable is a single, unglamorous number that most small businesses never calculate: the pipeline coverage ratio. It’s the earliest warning signal available in sales, and it’s arithmetic you can do in ten seconds.
Why revenue targets warn you too late
The problem with tracking revenue against target is that revenue is a lagging indicator. It tells you what already happened. By the time the number is visibly short, the causes are months in the past and the window to fix them has closed.
Sales has a built-in delay: a deal takes weeks or months from first contact to signature. So this quarter’s revenue was determined by last quarter’s activity, and this quarter’s activity determines the next one. Watching revenue is like steering a ship by looking at the wake.
Coverage is a leading indicator. It looks at what’s in the pipeline now and asks whether that’s enough to produce the revenue you need later. Which is the question you can still act on.
The calculation
Pipeline coverage is:
Open pipeline value ÷ your target
That’s it. If you have $120,000 of open deals against a $40,000 target, your coverage is 3.0x.
The number you need depends on your win rate. If you close roughly a third of the deals you pitch, you need about 3x your target in open pipeline just to stand still — because two-thirds of it won’t close. If you close half, 2x might do. If you close one in five, you need 5x.
So the useful version of the question isn’t “do I have enough pipeline?” — it’s “do I have enough pipeline given how often I actually win?” Which means you need your own win rate, from your own closed deals, rather than a number you assume.
And here’s the crucial part: you need that coverage in place months in advance, because of the sales cycle. Coverage measured today isn’t about today. It’s about the quarter that starts when today’s deals mature.
Weighted, not raw
One refinement that matters. If you’re measuring coverage against your raw pipeline total, you’re flattering yourself twice over — because that total treats a deal you had one conversation about the same as one where a contract is being reviewed.
A more honest picture weights each open deal by the probability of its stage: a deal at proposal counts for much more than a deal at first contact. Add up the weighted values and you get a forecast rather than a wish list. Both numbers are worth seeing side by side, because the gap between them is itself informative — a big gap means your pipeline is mostly early-stage, which tells you something about the next two quarters.
An honest caveat, though: those probabilities are yours to choose, and any default set is a starting point rather than a truth. Common defaults vary enormously by market, deal size and sales motion. Once you’ve closed a reasonable number of deals — thirty or so — you can calculate your own: of the deals that reached proposal, what share did you actually win? That number is almost always different from the default, and using it is what turns a guess into a forecast.
Either way, a weighted forecast is an estimate. It won’t match what actually closes. Its value is in direction and early warning, not precision.
What to do when coverage is low
Finding out early is only useful if you act, and low coverage has a small number of honest responses:
- Prospect harder now, accepting the results land next quarter rather than this one. This is the main lever, and it only exists if you find out early.
- Work what you have more actively — deals sitting untouched don’t progress themselves.
- Adjust the target, if the pipeline genuinely can’t support it. Better to reforecast honestly in month one than to miss quietly in month three.
- Look at where deals stall. If one stage is full and never empties, that’s a process problem, and fixing it lifts coverage without adding a single lead.
What you can’t do is nothing, and what doesn’t work is a panic in the final month. The whole value of coverage is that it buys you time.
And when coverage looks great
Worth saying, because it catches people the other way: high coverage isn’t automatically good news either. A large pipeline full of stale, early-stage deals that never move is not the same as a healthy one — it’s a list. If coverage is high but your win rate is falling or deals keep aging, the pipeline is inflated rather than strong.
That’s why coverage is best read alongside two other things: how long deals have been sitting untouched, and where in your stages they’re piling up. One number tells you the size; the others tell you whether it’s real.
An important note
To be clear: this is a general explanation of how these metrics work and a way of organising your own figures. It is not sales, financial, accounting, legal, or professional advice; it is not a substitute for CRM software; and it guarantees no result. All figures mentioned are illustrative examples, not benchmarks. Coverage ratios, win rates and stage probabilities vary enormously by market, deal size and sales motion — use your own numbers rather than anyone else’s. A weighted forecast is an estimate built on probabilities you choose and will not match what actually closes.
If you want it calculated for you
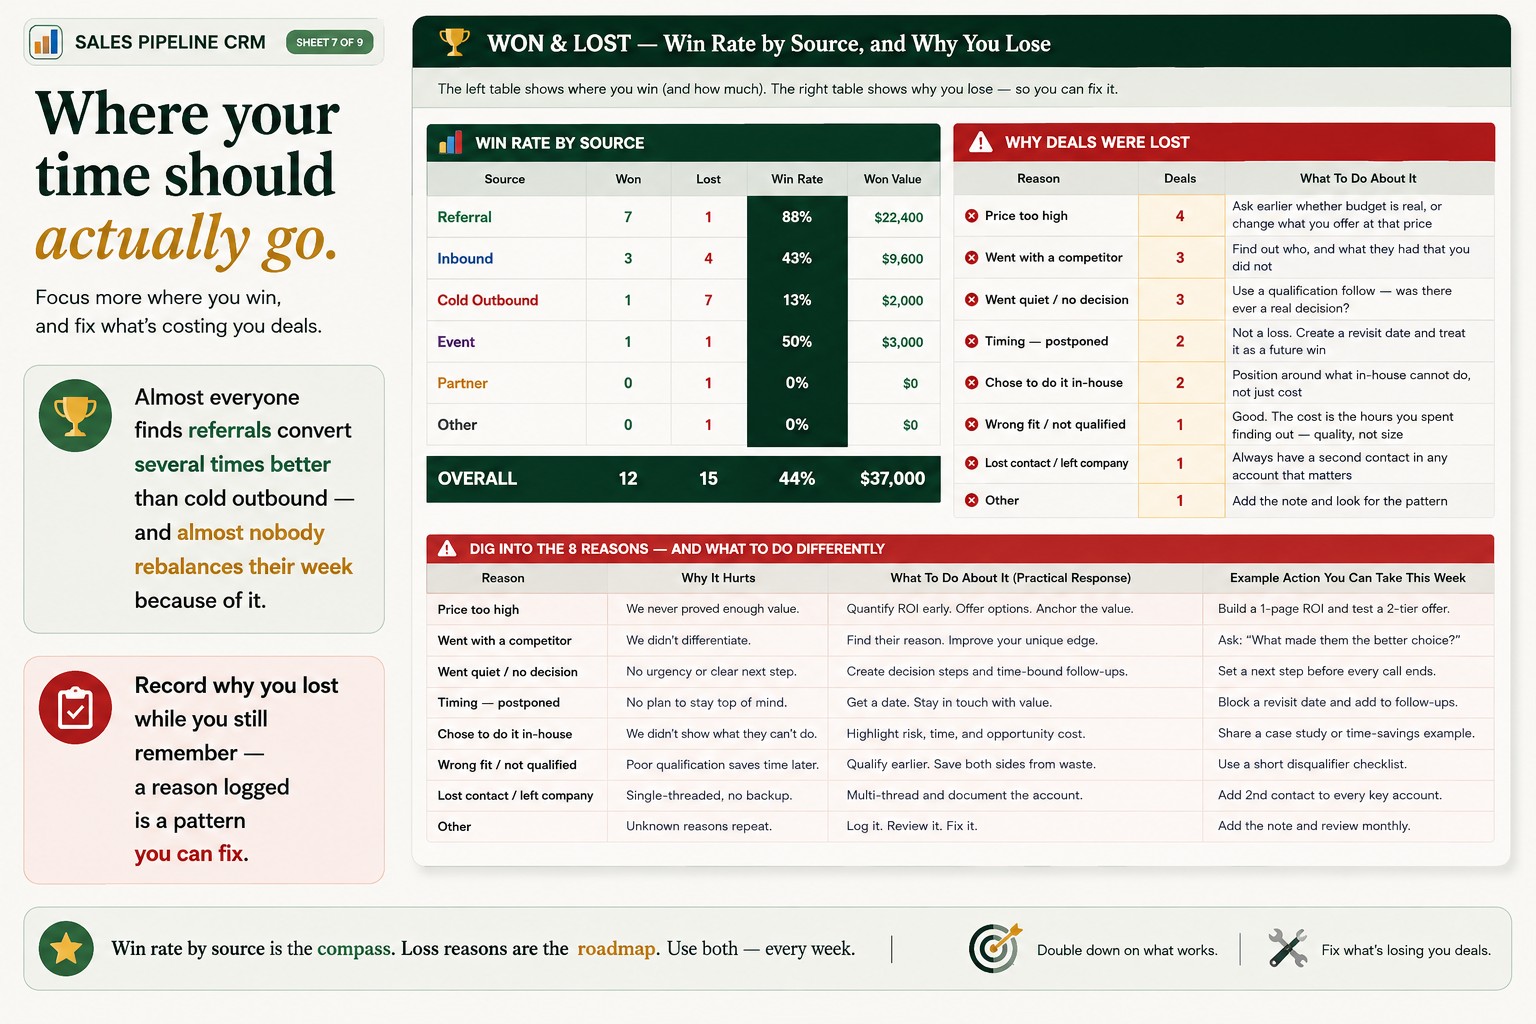
I built a sales pipeline CRM in Google Sheets that does this automatically — weighted forecast alongside your raw pipeline total so the gap is visible, coverage ratio against your target, win rate calculated overall and by source from your own closed deals, and a stage view showing exactly where deals pile up:
👉 Sales Pipeline CRM for Google Sheets & Excel
(No integration or import — you enter everything manually, which is why it works whatever else you use.)
Whether you use mine or a calculator, work out your coverage this week. Divide your open pipeline by your target, compare it to what your win rate demands, and find out now rather than in week ten. The quarter you’re going to miss is usually decided long before it feels like it — and coverage is the only number that says so while you can still do something. 📊
This reflects my own perspective and describes a tracking tool — NOT sales or financial advice, not a substitute for CRM software, and it guarantees no result; figures are illustrative, not benchmarks, and forecasts are estimates that won’t match what actually closes. Do you know your coverage ratio? Tell me in the comments.