Margin Can Lie to You. Profit Per Hour Can’t.
A 40% margin sounds healthy — and can still pay you less than minimum wage if the product takes long enough to make. Here’s the number that should decide what you make more of.
Most business advice tells makers to watch their margin, and margin is a genuinely useful figure. But for a handmade business it has a serious blind spot, and it’s a blind spot that can quietly keep you poor while your numbers look fine. Margin tells you what share of the price you keep. It says nothing at all about how long the thing took to make. So a product can show a comfortable margin and still be a terrible use of your day. The figure that closes that gap is profit per hour — and once you start looking at it, your sense of which products are worth making changes, sometimes dramatically.
Why margin misses the point for makers
Consider two products. Both sell well. Both show roughly the same healthy margin. By any margin-based analysis, they’re equally good.
Now add the missing dimension: one takes twenty minutes to make, the other takes three hours. Suddenly they’re not remotely comparable. In the time it takes to produce one of the slow item, you could make nine of the quick one — nine sales’ worth of profit instead of one.
That’s the blind spot. Margin is a ratio about money, and a handmade business isn’t limited by money — it’s limited by time. You can’t make more hours. Every hour you spend on a low-return product is an hour unavailable for a high-return one, and margin has no way to express that.
Profit per hour does. It’s simply the profit a product generates divided by the hours it takes to make and handle. It combines both things that actually matter: what you keep, and what it cost you in the only resource you genuinely can’t get more of.
The product that’s losing money on every sale
Here’s where it gets uncomfortable, and useful. When makers calculate profit per hour properly for the first time — with all the time counted, overhead included, and platform fees taken off — a common discovery is that at least one product in the range is losing money on every single sale.
Not obviously. It looks perfectly reasonable on the shelf. It sells steadily. It might even be popular. But once its true cost includes the making time, the admin time, the packaging and the fees, the price doesn’t cover it — and every unit sold takes a small bite out of the business.
The reason this hides so well is that it’s popular. Sales feel like success, so a product that sells regularly gets categorised as a winner and never examined. Meanwhile the losses accumulate quietly, and the maker experiences it only as a vague sense of working hard and having nothing to show.
Seeing it stated plainly — this many units sold, this much lost, this many hours spent going backwards — is a bad afternoon and a genuinely valuable one. Because now it’s fixable: reprice it, redesign it to take less time, batch it, or retire it. Any of those beats continuing.
“What should I make more of?” — answered with data
The flip side is the more cheerful discovery. Ranking your range by profit per hour usually reveals that your best earner isn’t your bestseller. Something slightly less popular, but far quicker to make, can generate considerably more money per hour of your life.
That reframes the most important planning question a maker faces. “What should I make more of?” is usually answered by intuition, by what sells, or by what you enjoy — all legitimate inputs, but none of them tells you what pays. Ranked by hourly return, you can see it.
And you don’t have to obey the ranking slavishly. Plenty of makers keep a lower-earning product because they love making it, or because it draws people into the shop, or because it rounds out a range. Those are good reasons. The point is to make that choice knowingly — to keep a product because you’ve decided it’s worth it, rather than because you never checked.
Estimates are wrong; measure once
One practical caveat that makes all of this more accurate: your sense of how long things take is probably optimistic. It’s a well-known pattern, and makers are no exception — it’s common for actual times to run meaningfully above estimates once you actually measure.
That matters because every profit-per-hour figure rests on the time input. If your times are 25% low, your hourly earnings are overstated by roughly the same amount, and the products you think are fine may not be.
The fix is straightforward: for each product, time yourself properly once — including setup, cleanup and the fiddly bit you always forget — and compare it to what you’d assumed. It’s a small piece of work that makes every other number in your pricing trustworthy. And it doesn’t need repeating often; make times don’t change much until your process does.
The floor, not the answer
A closing caution, because pricing tools can be oversold. Nothing can tell you the “right” price for your work, and I’d be sceptical of anything that claims to. What costing gives you is:
- Your floor — the price below which you’re losing money, which you should simply never go under.
- The truth about your current prices — what they actually pay you per hour, right now.
- A reference point — what the standard multipliers would suggest, as a ceiling and a wholesale guide rather than a target.
The final price still depends on your market, your product, your positioning and your customers. But there’s a world of difference between choosing a price with those numbers in front of you and choosing one because it “felt about right.” One is a business decision; the other is a hopeful guess.
And if the arithmetic says your prices are too low for your market to bear, the answer is usually to attack the cost — batch making, better material buying, simpler designs, faster processes — rather than to quietly write off your own hourly rate. That’s the one variable that shouldn’t be the flex.
An important note
To be clear: this is a general explanation and a way of organising your own figures. It is not financial, accounting, tax, legal, or business advice, and it guarantees no result. Figures are illustrative; yours will differ. Platform and payment fee rates change and vary by country, category and seller — always check and enter your own current rates. Pricing multipliers are conventions, not rules. Consult a qualified accountant or business adviser about your own circumstances.
If you want it ranked for you
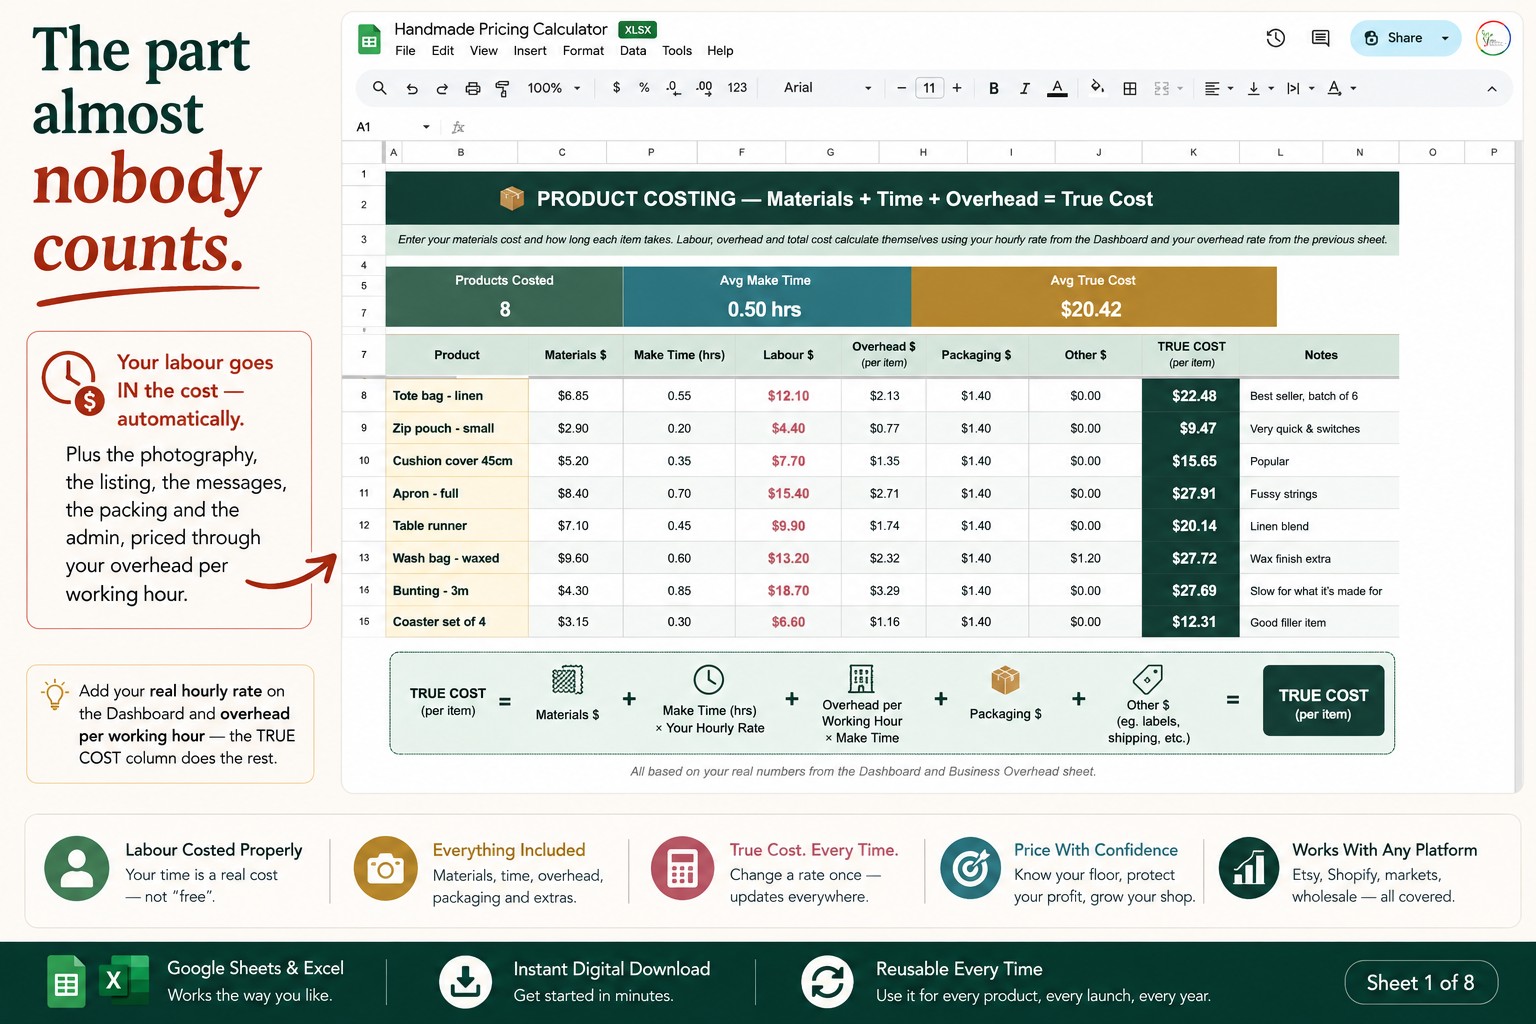
I built profit-per-hour into my handmade pricing calculator in Google Sheets — every product gets its hourly return with a Healthy, Thin or UNDERPRICED verdict against your own target rate, and a “what to make more of” page ranks your whole range by what actually pays, with a time tracker showing how far your estimates were off:
👉 Handmade Pricing Calculator for Google Sheets & Excel
Whether you use mine or a calculator, stop judging your products by margin alone. Work out what each one pays you per hour, rank them honestly, and let that inform what you make next season. Margin describes the money. Profit per hour describes your life. 🏷️
This reflects my own perspective and describes a costing tool — NOT financial, accounting or business advice, and it guarantees no result; figures are illustrative and platform fees vary. Makers: has a product ever turned out to be worse than you thought once you did the maths? Tell me in the comments — you won’t be alone.